
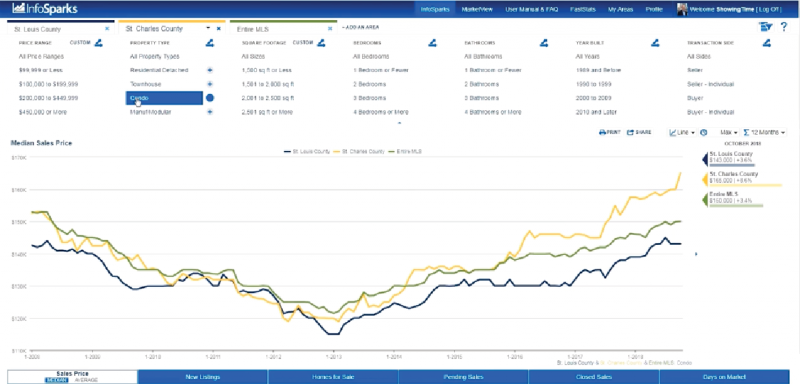
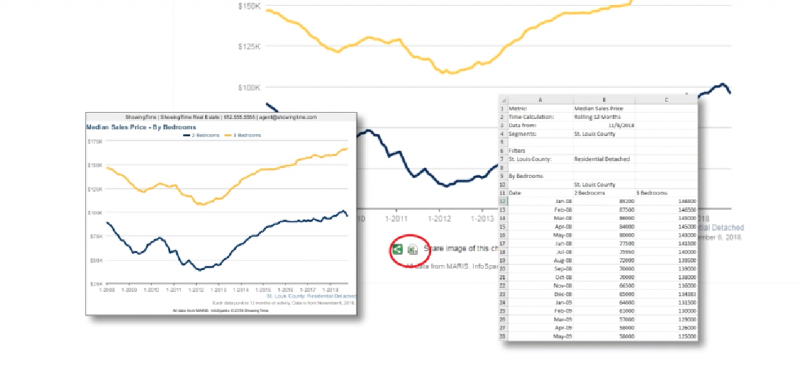
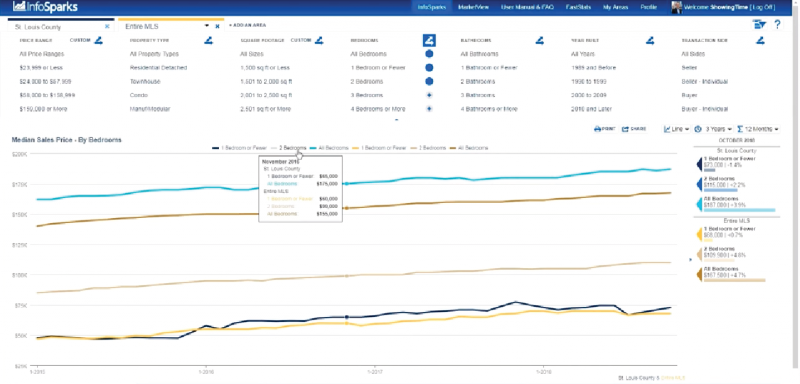
InfoSparks Charting & Time Tables
InfoSparks allows you to chart local housing trends as line charts and bar charts with many time frames (like 3 years, 5 years and 10 years) and time calculations (like monthly, rolling 6 months and rolling 12 months).
Related Videos
Videos
Product
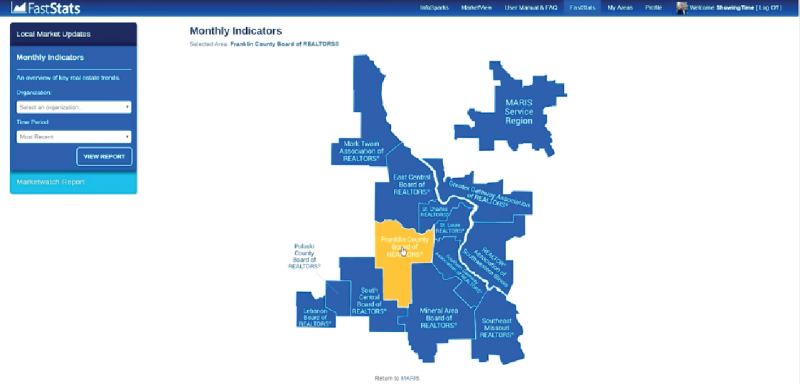
FastStats and Market Reports
FastStats provides a map-based interface leading to...
MarketStats
Related Products