
Tis’ the season for holiday celebrations and end-of-year reviews!
The end of the year for many is synonymous with time spent with family and friends over meals and social gatherings. For REALTORS®, it can also be synonymous with slowdowns in the housing market — making it an opportune time to evaluate your business and review the performance of the market in 2019.
Before you begin planning for 2020, below are some reports to help you analyze this year’s housing trends and summarize the overall performance of your business for the year.
MarketStats: FastStats Annual Report
The FastStats Annual Report provides a summary of national housing trends for the year in review and an outlook on real estate for the year to come. You can also find insights on the health of the MARIS marketplace.
The Quick Facts section provides charts and graphs of common market statistics, such as number of closed/pending sales, new listings, medium sales price and more. Each key area includes results from the past five years and lists top/bottom five performing counties in the MLS.
Other key components of the FastStats Annual Report include reviews of property types, home prices, bedroom counts, showings, and overviews of each market area in the MLS.
This report is typically generated early January and is a great way to quickly gather pre-generated market data.
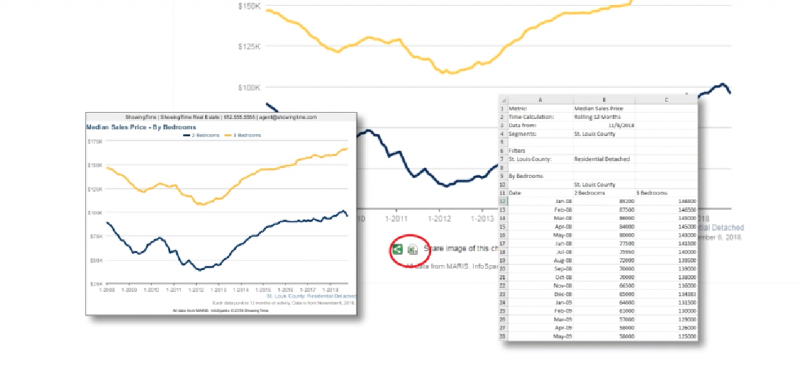
MarketStats: InfoSparks Report
If you prefer to create your own year-end report and do not want to wait until January, you can easily do this with InfoSparks.
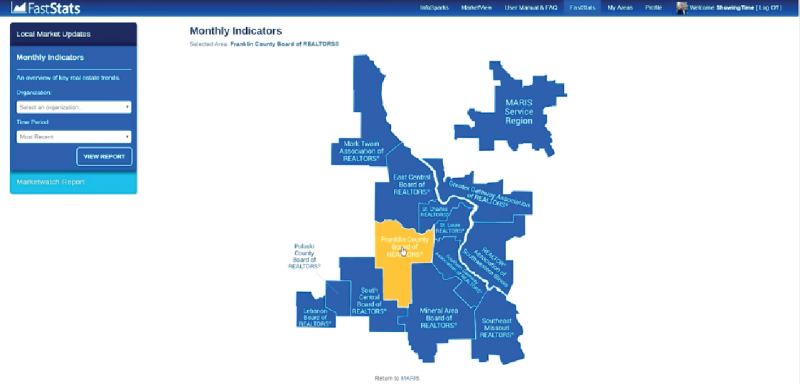
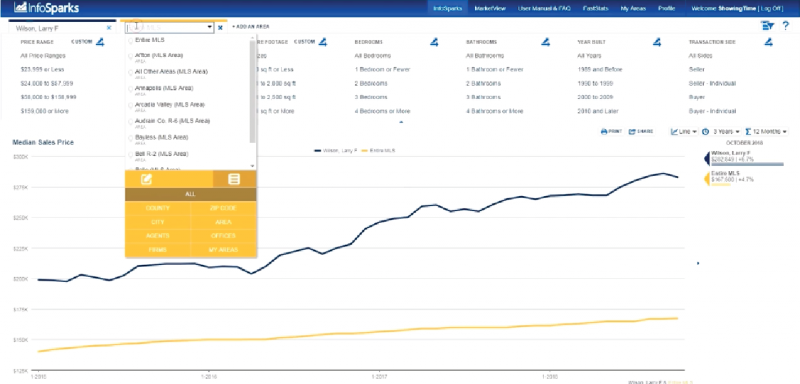
You can start by going to the My Areas tab to create a custom market area using the polygon and circle draw tools. Once you’ve created your custom area, you can select it from the dropdown in the InfoSparks criteria section (see below). If you do not want to create a custom area, you can select a predefined area from the dropdown.
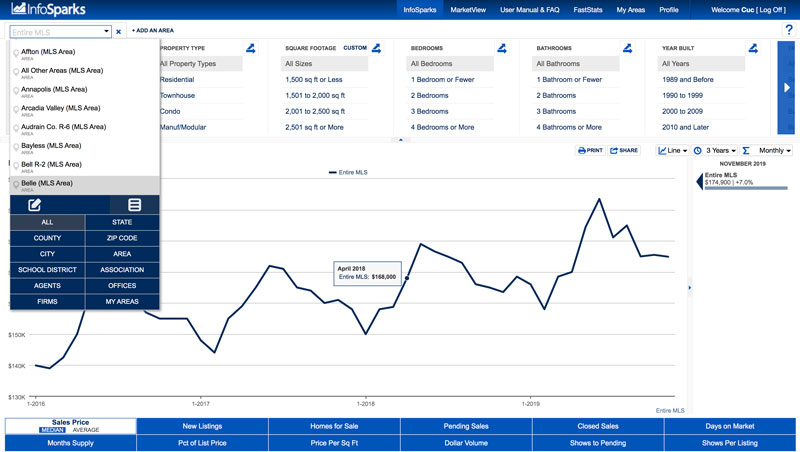
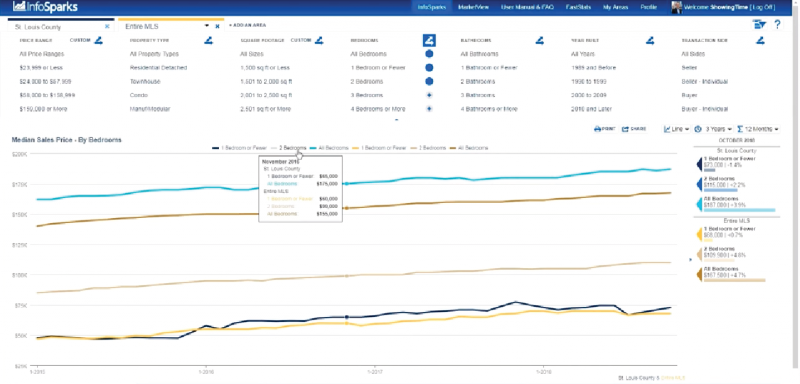
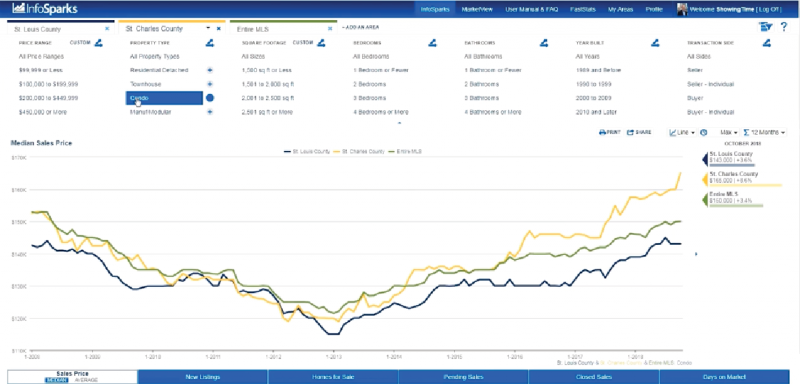
There are 12 metrics available, including medium sales price, pending/closed sales, days on market, months supply of homes for sale, and more. Static graphs are great for printing, but we recommend using a live graph when sharing digitally via a link (on social) or embed code (on your website). The live graph provides you the ability to deliver the latest data to your clients each time the page is refreshed. Help your clients stay informed and up-to-date!
If you need help navigating through these reports, you can attend our in-person MarketStats class to learn more.
Matrix: Agent Product and Inventory Report
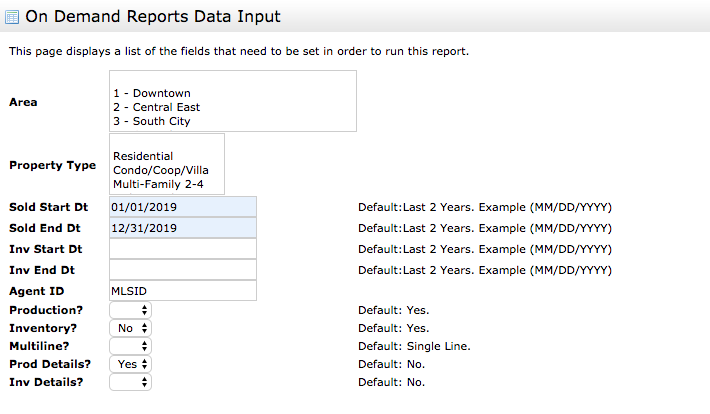
In Matrix, there are a number of on-demand reports that you can create under the Market Reports tab. The Agent Production and Inventory Report provides a summary of your sales for the year:
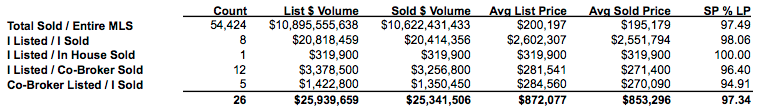
There are only a few pieces of information needed to generate the report: inventory start/end dates, MLS ID, inventory set to “no”, and product details set to “yes”. The latter two fields will ensure that only sold properties are included in the report and will also provide records of each listing.
If you have any questions, don’t hesitate to reach out to us!